Wondering how the tests work?
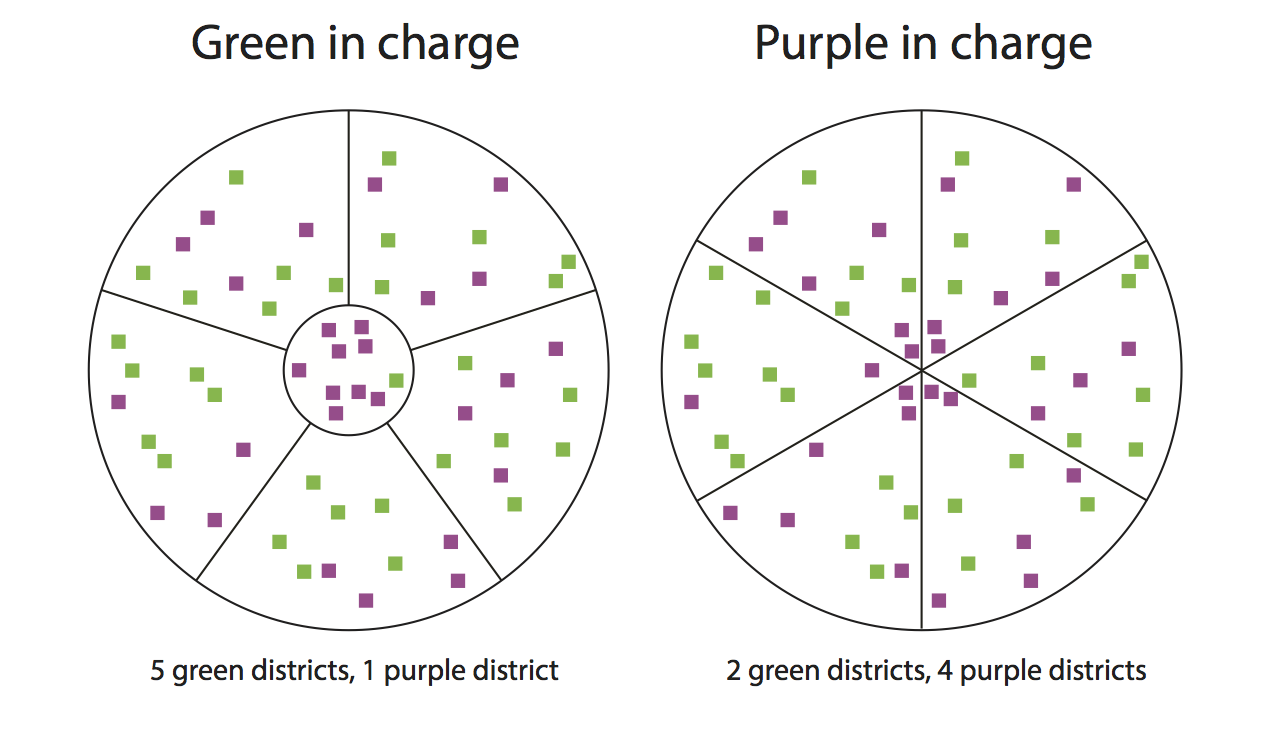
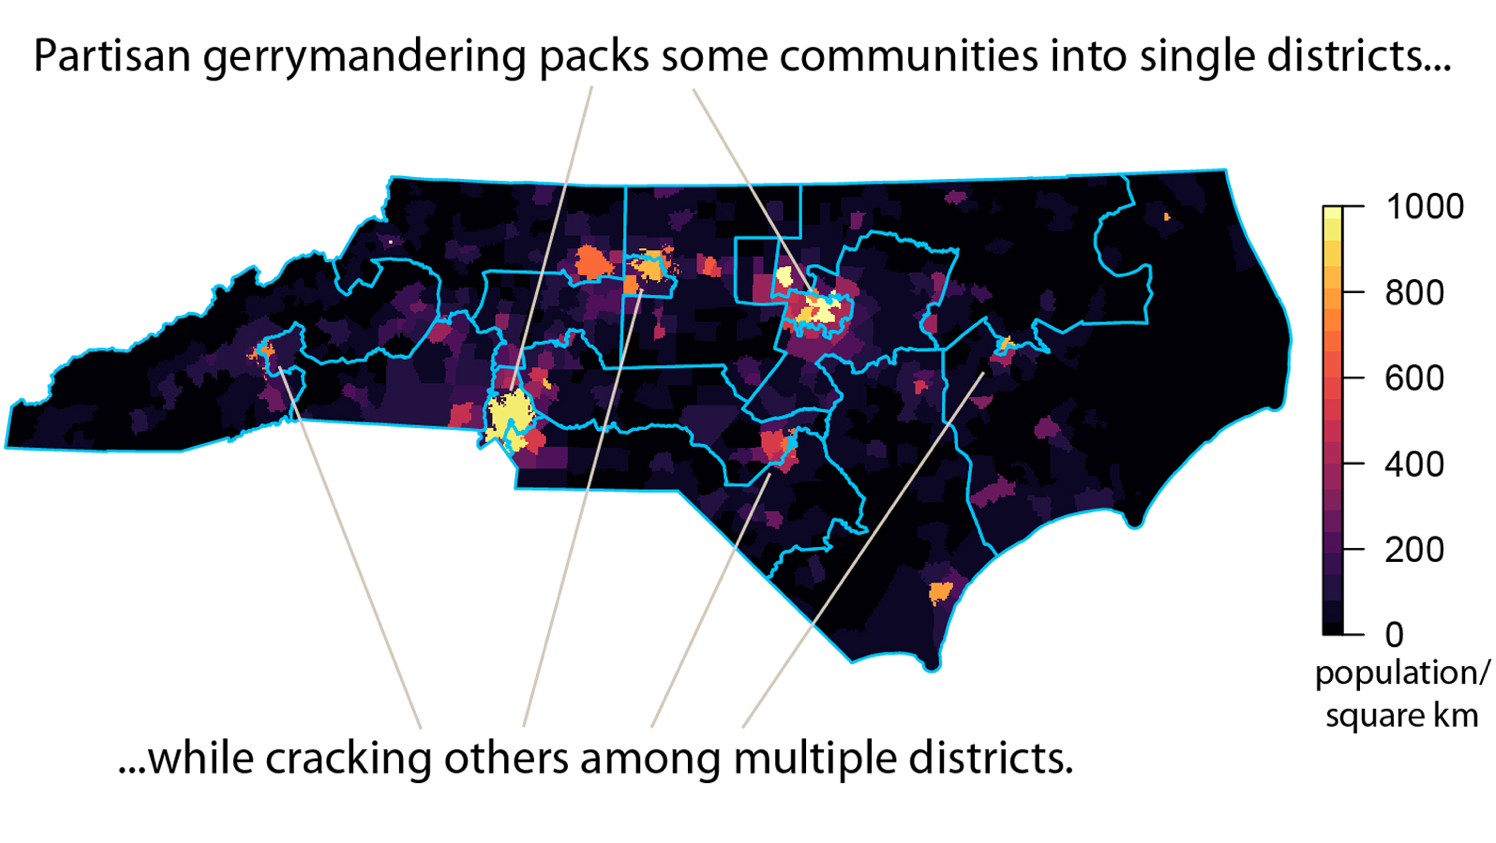
The goal of partisan gerrymandering is to amplify a political party's power beyond what it deserves based on their vote share alone. This process is accomplished by two complementary methods: packing and cracking. "Packing" occurs when many supporters of the victim party are jammed into a small number of districts, giving them a few overwhelming wins. The remaining members of the victim party are then "cracked," spread across a large number of districts, so that they consistently win just under 50% of the vote. Luckily, packing and cracking creates a distinctive pattern of wins for both the perpetrator and the victim parties, wherein the victim party wins its few seats by overwhelming margins and the perpetrating party wins its many seats by considerably lower margins. This pattern, and thus partisan gerrymanders, can be detected with the help of a little math.
Lopsided Wins (t-test)

The two-sample t-test, perhaps the most widely used statistical test of all time, tests how similar two groups of numbers are. In the case of gerrymandering, the t-test can determine how similar the winning vote shares are for the districts won by Democrats to those for districts won by Republicans. In a perfectly fair world, it could be assumed that these two groups of vote shares would be very similar. Each party might expect to see wins in a mix of strongly partisan districts, moderately reliable districts, and tossups—but each party should expect to have a roughly similar mix. In a gerrymandered state, by contrast, the victim party mostly has strong wins (in their packed districts) and the perpetrating party mostly has small but safe wins. The t-test can check for this distinctive pattern of lopsided outcomes, and can check for the probability that such a pattern might have arisen by chance. If an outcome was unlikely to have occurred by chance alone, that may indicate that the state suffered a partisan gerrymander.
We use the two-tailed t-test, which can be performed in Microsoft Excel using the T.Test function.
Consistent Advantage (Mean-Median Difference)
Partisan gerrymandering can also be detected by comparing a party's statewide vote strength to the number of Congressional seats it wins. As mentioned above, in a gerrymander of a state in which the vote is roughly evenly split between parties, many of the supporters of the victim party are crammed into a few districts that they win overwhelmingly, and the remaining supporters are spread across districts that they lose by small margins. This effect can be discerned by examining the difference between the mean and median vote shares of either party. A large difference between the mean and median is unlikely to arise by chance, and therefore may be indicative of a partisan gerrymander.
The mean-median difference is simply calculated by subtracting the median vote share of either party across all districts from the average vote share of the same party across all districts. A negative mean-median difference indicates that the examined party has an advantage; a positive difference indicates that the examined party is disadvantaged. A z-score for the effect can be calculated by dividing the mean-median difference by the standard error of the party's vote share across districts, then applying a correction factor of .5708, as described in A Simple Test of Symmetry About an Unknown Median by Cabilio and Masaro (1996).
In states where one party dominates at a statewide level, the mean-median difference becomes less robust. In those situations, tests of variance can be applied to detect asymmetric advantage, as described in our Election Law Journal article.
Excess Seats (simulated elections)

Another way to detect possible gerrymanders is to examine how much the makeup of a state's Congressional delegation deviates from national results, given the state's party divide. The statistical method for such analysis is Monte Carlo simulation, or bootstrapping. Essentially, this test is a Congressional version of fantasy baseball—out of the 435 districts nationally, randomly pick as many as are in the state of interest, check if they match the overall partisan makeup of the state and, if they do, record the party split of the districts' Congressional delegation. Repeat the process millions of times, then compare the results of the simulations to the actual state results.
A set of districts is said to match the partisan makeup of a state if the total vote share for each party across all districts is within 0.1% of the actual vote share across all districts. We then determine the proportion of simulations that had outcomes as or more advantageous to the dominant party than occurred in reality (e.g. in states with a majority Democratic delegation, the number of simulations with as many or more Democratic seats).